|
 |
 |
 |
 |
|
Daily
At-Sea Logs May 4th, 2003 |
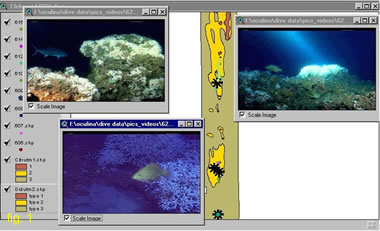
May 4, 03 Oculina GIS: Exploration Roadmap By: Andrew Shepard, Assoc. Director, National Undersea Research Center at the University of North Carolina Wilmington Geographic Information Systems (GIS) are essentially organized collections of geospatial data—mapped information. They are very good for viewing and analyzing large varied datasets from a geographic region. Inputs include graphics and tables of point data. The graphics are often geotif map images that are accurately placed within a standard geographic network—there are many in the U.S. If the coordinate system that was used when the data was collected is known, then the geotif maps can be precisely overlain on top of each other within a GIS. Oculina
GIS organizes data sets from the past 30 years, with a Web interface
for much of these data. (figure 1) NOAA Fisheries, primary sponsor of this expedition, is also supporting development of an Oculina GIS (OGIS) to integrate the various data sets that have been collected in the Oculina Banks marine protected area over the past three decades. The list currently includes: ·
NOS single-beam echosounder bathymetric (depth) chart data from the
1960s (their latest surveys)
·
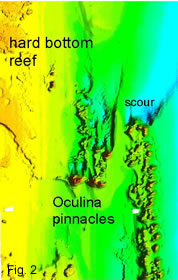
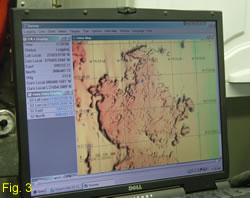
J. Reed imagery from submersible dives in the 1970s and 1980s The value of OGIS has been realized in planning and carrying out this year’s expedition. Our ROV dive sites were precisely located on the high resolution multi-beam map. We were able to easily target features and areas that we knew had never been explored before, or had not been explored in the past 20 years. OGIS images were exported to the software used to direct the ROV dives by the pilot and ship. Handy tools included with the ESRI ArcView program include quick ways to measure distance, depth, and position.
Some OGIS datasets can now be viewed online at www.uncw.edu/oculina. |
 The
South Atlantic Fisheries Management Council and many other coastal
management groups now have GIS experts on staff. OGIS will undoubtedly
become part of a larger regional system in development for South Atlantic
Bight offshore habitats. We all realize the need to know where we
have been and where we are going.
The
South Atlantic Fisheries Management Council and many other coastal
management groups now have GIS experts on staff. OGIS will undoubtedly
become part of a larger regional system in development for South Atlantic
Bight offshore habitats. We all realize the need to know where we
have been and where we are going.