| Charleston
Gyre |

 |
 |
 |
February 7, 2003 The main components of the CTD are housed in a cylindrical, water-tight housing. Inside of this compartment are the electronics needed to acquire the data, a microprocessor that controls data acquisition, memory to store the data and batteries to power the instrument. Attached to the outside of the main housing are the primary sensors: pressure, temperature and conductivity. Since pressure changes with depth (higher pressure at deeper depths), data collected with the pressure sensor are used to calculate the depth at which the CTD is recording. A thermistor (thermometer) is used to measure temperature. The specific conductivity sensor is composed of a glass tube, or cell, with three electrodes inside. As water flows through the cell, the sensor measures the electrical resistance in the fluid between the center electrode and the end pair electrodes. This value is the specific conductivity, which in and of itself is not of great interest. However, these data are used by the CTD to calculate salinity, which is usually one of the major parameters of interest. A pump is attached to the specific conductivity cell to make sure adequate water passes over the sensor. The main housing unit, along with the sensors, are surrounded by a steel frame with a metal eye ring on the top for attaching a cable. Other instruments, such as oxygen sensors and fluorometers (which measure chlorophyl concentrations,) can be added to this basic setup. The CTD used on this cruise, for example, has a light sensor attached to it, in order to measure photosenthetically active radiation, or PAR. PAR is that part of the energy spectrum that is important for photosynthesis, and is composed primarily of the same wavelengths as the visible spectrum. Deployment of the CTD
actually begins inside the ship's dry lab. A communication cable on
the CTD is plugged into a computer with the CTD software. We are then
able to program the CTD to measure what we want and at what rate we
want. On our cruise, we want readings for all of our sensors (temperature,
pressure, conductivity and light) at 2 Hz. That means the sensors scan
for data every 0.5 seconds, or two times per second. Once these commands
are entered, the CTD is initialized and ready to record data. Now the
deployment is mainly in the hands of the ship's crew. A cable is attached
to the eye ring on the CTD frame. Since the instrument is likely to
encounter different water masses and currents as it is being lowered,
a heavy weight (75 pounds) is attached to the bottom of the CTD frame.
This will help keep the CTD wire as straight as possible as it descends.
The CTD is turned on and the instrument is boomed over the side of the
boat and lowered into the water. The instrument is lowered by winch
to the desired depth at about 10 meters per minute. At this rate, it
takes approximately 20 minutes to reach a The file is now in a data storage format (hexadecimal), which is not a very good format for calculations and data manipulation. The data, therefore, must be processed with the CTD's software to make any sense. There are several processing steps that help put the data in a useable format. One step, for example, allows us to average all of the scans into depth bins. At a sampling rate of two scans per second, we collect a lot of data points during one CTD cast. We are not interested in changes that may occur on small scales (centimeters). Rather, we are using the computer's software to average data into one meter depth bins. All scans taken between 0 and 1 meters depth, for example, are averaged together and one value is reported for that depth range. Another processing step is used to convert the data from hexadecimal format to a more user-friendly format. Yet another step removes data points that the software deems "bad scans", perhaps due to a sensor glitch of some kind. Using these and other steps, we are able to "clean up" the data for further analyses. So how does the CTD data
help us get an idea of what's going on beneath us? First of all, we
need more than one CTD cast to give us any useful information. One CTD
cast gives us vertical information for one point in the ocean. We therefore
take multiple CTD casts along a transect, or a line, that we've mapped
out. If we have information for five points along a line, we can use
statistical and graphic software to interpolate (or estimate) the data
that is between these points. The attached figure is a contour plot
of one of our transects across the sampling area. The only "real"
data points are those along the sampling stations (22-26). These stations
are roughly five miles apart, so the information in between is interpolated.
The data are then color-coded to represent different values under the
sea surface. Career of the day Mike Green, Biological
Science Technician – Fisheries, Beaufort lab. While in school, Mike volunteered with numerous agencies. He worked for State Wildlife Management with endangered species, Camp Lejeune on a deer harvest project, Ft. Bragg and a turtle rescue project to name a few. When he graduated he sent out resumes and applications and was hired by NOAA’s National Marine Fisheries Service. He still loves it. His duties include supporting the principal investigators on cruises such as this one. This entails operating the MOCNESS, operating boats, repairing and maintaining equipment and compiling and analyzing data. He likes working with different equipment, likes the people he works with and enjoys seeing the final product when all the data has been analyzed and the results are published. Mike also sketches many of the fish species that he works with. There’s nothing he doesn’t like about his job but his advice would be to make sure you don’t get seasick, are able to live in small quarters, and are able to be away from friends and family for weeks at a time. Mike said he would be a
sunfish (mola mola) if he had a choice. He said they’re unique,
they range around the world, and no one could dislike the sunfish because
it’s so pretty. |
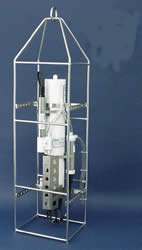 primary
physical variables the instrument can measure and record. A CTD, therefore,
allows us to characterize and describe the water under the ship. The
instrument can simply be placed over the side of a boat and lowered
to a specified depth (vertical data recording), or it can be configured
for towing behind a vessel (horizontal and vertical data recording).
Our CTD is a SBE19 (Seabird Electronics, Inc.) and is designed for vertical
data recording, or profiling. With measures of temperature, depth and
conductivity, we are able to use equations to calculate other important
parameters, particularly salinity and density.
primary
physical variables the instrument can measure and record. A CTD, therefore,
allows us to characterize and describe the water under the ship. The
instrument can simply be placed over the side of a boat and lowered
to a specified depth (vertical data recording), or it can be configured
for towing behind a vessel (horizontal and vertical data recording).
Our CTD is a SBE19 (Seabird Electronics, Inc.) and is designed for vertical
data recording, or profiling. With measures of temperature, depth and
conductivity, we are able to use equations to calculate other important
parameters, particularly salinity and density. 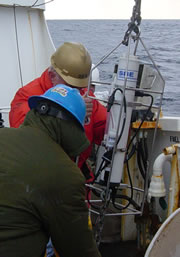 depth
of 200 meters. Once it reaches the desired depth, the CTD is retrieved
and returned to the ship's dry lab. There, the communication cable is
connected to the CTD once again and the data is downloaded and saved
onto the computer's hard drive.
depth
of 200 meters. Once it reaches the desired depth, the CTD is retrieved
and returned to the ship's dry lab. There, the communication cable is
connected to the CTD once again and the data is downloaded and saved
onto the computer's hard drive.
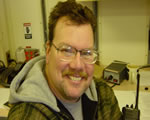 Mike has 2 associates degrees. One is in science, the other in fisheries
management. Mike was brought up in the outdoors and has always enjoyed
it. He decided one day that he needed a career change from being a drummer
in a band, so he went back to school. While working on his science degree
he enjoyed the ichthyoplankton and zoology classes and decided to go
on and get his fisheries management degree as well.
Mike has 2 associates degrees. One is in science, the other in fisheries
management. Mike was brought up in the outdoors and has always enjoyed
it. He decided one day that he needed a career change from being a drummer
in a band, so he went back to school. While working on his science degree
he enjoyed the ichthyoplankton and zoology classes and decided to go
on and get his fisheries management degree as well.| Ph.
843-953-7263 |
Project
Oceanica Dept. of Geology & Environmental Geosciences College of Charleston Charleston, SC 29424 |
Fax
843-953-7850 |