|
Thursday, May 12, 2005
Hello once
again from the R/V Nancy Foster.
We are now
in the full swing of surveying as we have successfully
completed two dive trips so far and it is only 1530 hours…that’s
3:30 PM for you landlubbers. Each day there are two dive
trips planned, one in the morning and the other in the
afternoon. During each trip, two boats are deployed, each
containing two to three divers.
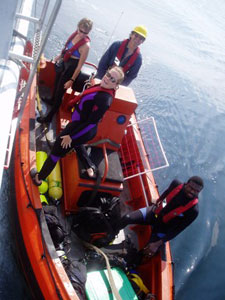
Deploying divers
is no easy task. It takes a coordinated effort among the
ship’s crew and the scientific staff. When it is
time to dive, the small boats located on the ship’s
aft deck are lifted and placed into the water. Once in
the water, the divers board the boats and are taken to
specific locations of interest within GRNMS. Each dive
location is identified as being one of the four habitats
to be explored throughout the expedition (e.g., rippled
sand, flat sand, densely colonized hard bottom, and sparsely
colonized hard bottom).
Safety is a
huge issue for the dive team and all steps are taken to
make sure that the divers are safe. Since visibility is
low and the divers are working in depths of 60 feet or
more, it is important that the individuals remaining in
the boat can identify the position of the dive team at
all times. A weighted buoy is deployed directly over the
habitat of interest to orient both the diver, as well
as those in the boat. From this position two divers prepare
to collect data on the seafloor along a 25 meter transect.
 Before
leaving the boat, divers double check to make sure that
they have all of the gear that they need to collect data.
Materials include measuring tape, clipboards with ruler,
1 m2 quadrat, camera, pencil, and waterproof datasheets.
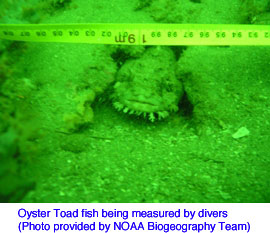
Once on the bottom, responsibilities are shared among
the teams of two divers. One diver is responsible for
identifying the different species of fish, their relative
sizes in increments of 10 cm (i.e., <10, 10-20, 20-30,
and so on until >70), and their abundance. The second
diver characterizes the habitat and fishing gear impacts
in five randomly placed 1.0m2 quadrats along the transect.
During the survey, marine debris is counted and collected.
(Today, Chris identified and collected fishing line and
aluminum cans in GRNMS.) Before
leaving the boat, divers double check to make sure that
they have all of the gear that they need to collect data.
Materials include measuring tape, clipboards with ruler,
1 m2 quadrat, camera, pencil, and waterproof datasheets.
Once on the bottom, responsibilities are shared among
the teams of two divers. One diver is responsible for
identifying the different species of fish, their relative
sizes in increments of 10 cm (i.e., <10, 10-20, 20-30,
and so on until >70), and their abundance. The second
diver characterizes the habitat and fishing gear impacts
in five randomly placed 1.0m2 quadrats along the transect.
During the survey, marine debris is counted and collected.
(Today, Chris identified and collected fishing line and
aluminum cans in GRNMS.)
Limited visibility
in this northwest part of the sanctuary is a result of
high input of organic matter from the Altamaha River which
makes the diving surveys more complicated. Daniela says
that this is due to the unusually high input of fluvial
discharge from the Altamaha. The entire Southeastern region
has experienced higher than normal averages of precipitation
this season. Under normal conditions, the Altamaha’s
discharge is 1500-1800 m3/second in the spring; however,
this spring the river discharge has been over 2000 m3/second!
Due to all of the recent rain, organic matter and sediments
are carried by the runoff, into the watershed, and out
to sea…and even to Gray’s Reef.
(It is not
hard to imagine the impact that humans have on environments
like GRNMS. After a thunderstorm, for example, think of
the runoff that storm water carries to our creeks, streams,
and rivers. This water combines with pesticides, herbicides,
motor oil, etc. and is carried out into our estuaries…the
same places that serve as nurseries for many fish which
our region’s economy depends upon.)
While the divers
collect data, Daniela and Kate are working diligently
in the Wet Lab monitoring the echo sounder platform. Meanwhile,
they collect CTD (Conductivity, Temperature, and Depth)
profiles of the area. Let’s check out the first
CTD profile of the trip.
On this CTD
profile, you’ll notice two lines, one in red (temperature)
and the other in blue (salinity). Salinity and temperature
are key factors in identifying and characterizing water
masses.
 Let’s
take a look at the temperature profile. Observe how the
temperature of the column is not the same throughout.
During this time of year, when the river discharge is
high and when heat from the sun increases, the surface
water is warm. Alternatively, the water below the surface
remains quite cold. The layer of rapidly changing temperatures
is referred to as the thermocline. (As the divers, such
as Jenny can attest, the water below the thermocline can
be quite a surprise, even when wearing a wet suit!)(Picture
to right) Let’s
take a look at the temperature profile. Observe how the
temperature of the column is not the same throughout.
During this time of year, when the river discharge is
high and when heat from the sun increases, the surface
water is warm. Alternatively, the water below the surface
remains quite cold. The layer of rapidly changing temperatures
is referred to as the thermocline. (As the divers, such
as Jenny can attest, the water below the thermocline can
be quite a surprise, even when wearing a wet suit!)(Picture
to right)
Now take look
at the salinity profile within the water column. The water
mass is not well-mixed seeing that there are stratified
layers of dissolved salts (measured as salinity) in the
ocean. Since fresh warmer water is less dense than salty
cold water, we find the fresh water at the top of the
water column with the more dense salt water at the bottom.
This layer of rapidly changing salinity is referred to
as the halocline.
As you’ve
noticed by looking at the profiles, the halocline and
the thermocline have inverse relationships. This means
that as you increase in depth of the water column, the
temperature decreases while the salinity increases. Though
the relationship among salinity and temperature will remain
the same as we explore the farther reaches of GRNMS, I
wonder how the temperature and salinity profiles will
vary.
The more I
learn, the more questions I have; lucky for me I have
a fantastic resource base…the scientists I am working
among. This week I will attempt to uncover the answers
to these questions and more.
If you have
a research question related to the activities here in
Gray’s Reef, don’t hesitate to email me. My
email is scientist10.nancy.foster@noaa.gov.
Until tomorrow,
Elizabeth
Gray’s
Reef National Marine Sanctuary:
Daily Connections to Scientific Inquiry & Nature of
Science
Organizing
Data:
Scientists
must plan their methods for data collection and documentation
well in advance of boarding the R/V Nancy Foster. Chartering
a ship like this one costs exorbitant amounts of money
and resources, so it is nearly impossible to go back and
collect data if we were unsuccessful the first time. Therefore,
the scientists must think ahead about the kinds of data
they are looking to gather, their methods, available resources,
schedules, etc. and use all of these factors to organize
their surveys.
|